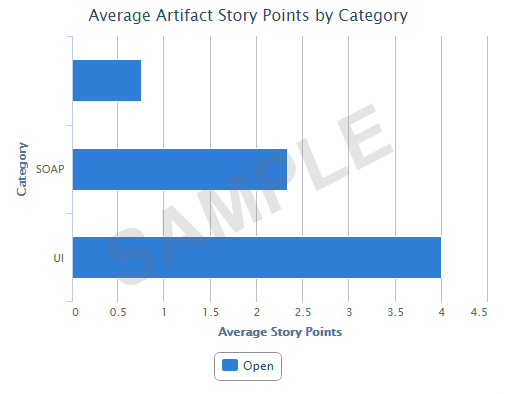
You can generate this chart for a specific sprint or release planning folder
(optionally you can include child planning folders, if any) and take stock of the average
size (as in average of story points or estimated, actual or remaining effort) of artifacts
and have them grouped by Group, Category,
Customer, Assigned To, Priority,
Tracker or Teams. You can generate this report for all
artifacts or just for open or closed artifacts.
Note: Unlike other reports (that use datamart), this report runs on your operational
database.
-
Click REPORTS in the project navigation bar.
-
Click Create in the List Reports
page.
The Select Report Type page appears.
-
Select Average Size by Area/Group from
Distribution Reports.
-
Type a report title and description.
-
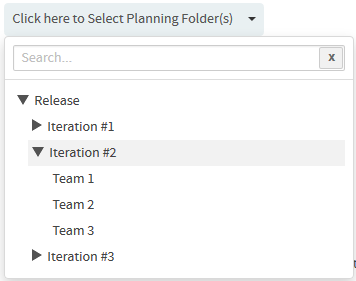
Select a planning folder from the SELECT PLANNING
FOLDER(S) drop-down list.
-
Optionally, select the Include: Child planning folders
check box to have the child planning folders, if any, included.
-
Select one or more trackers from the SELECT TRACKER(S)
drop-down list.
-
Select what you want to average from the
AVERAGE
BY
drop-down list. You can average by Story Points
or Estimated Effort or Actual
Effort or Remaining Effort.
-
Select an option from the
GROUP
BY
drop-down list to have the chart grouped by Group,
Category, Customer, Assigned
To, Priority, Tracker or
Teams.
-
Select one of the options, Include artifacts:
All (default) or Open
or Closed, to include all artifacts or just open or
closed artifacts respectively.
-
Leave the
CHART
DISPLAY
TYPE
as Bar, which is the only available chart type for this
report.
-
Select report visibility: Public or
Private.
-
Click Preview.
-
Click Create.
The report is created and the View Report page
appears.
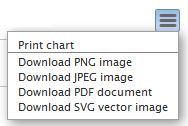
Print or download
charts
You can print charts or download them as .PNG, .JPG, .SVG
or .PDF files using the print/download quick function icon.
-
Click Back to Reports List to go back to the Reports
dashboard.


