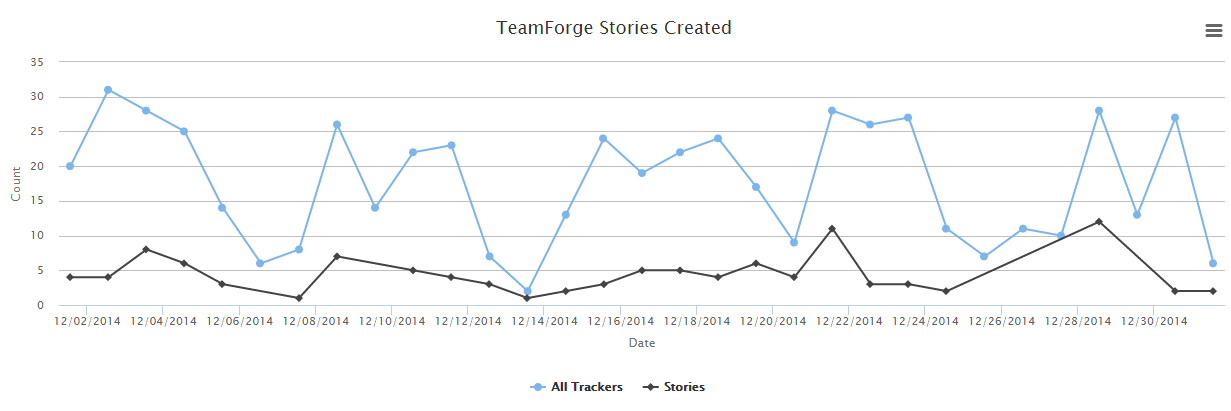
Shows the number of artifacts created in one or more selected trackers in a given time period.

- Click REPORTS in the project navigation bar.
- Click Create in the List Reports page. The Select Report Type page appears.
- Select Artifact Created from Activity Reports.
- Type a report title and description.
-
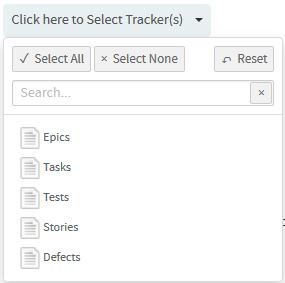
Select one or more trackers from the SELECT TRACKER(S)
drop-down list.

-
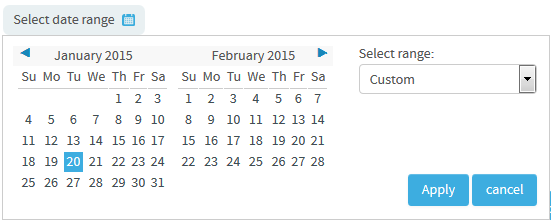
Select date range and click Apply.
To set the date range, select the start date first and then the end date. Use
the month/year navigation arrows to select the month/year you want. If you don't
have the exact dates at hand, you can also select one of the time periods from
the Select Range: Custom drop-down list.

- Select a chart type such as 'Line' or 'Bar' or 'Column' from the CHART DISPLAY TYPE drop-down list.
- Select report visibility: Public or Private.
- Click Preview.
-
Click Create.
The report is created and the View Report page
appears.
Print or download charts
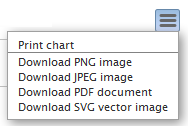
You can print charts or download them as .PNG, .JPG, .SVG or .PDF files using the print/download quick function icon.

- Click Back to Reports List to go back to the Reports dashboard.