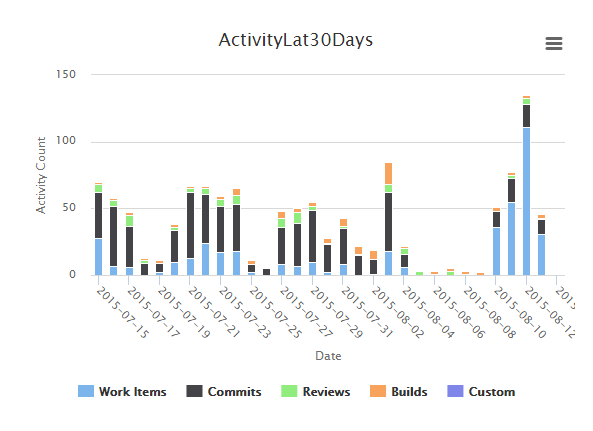
Shows the
count of
various
project
activities
over
a period of time
such
as
commits,
reviews, builds, and so
on.
This report is powered by data from the EventQ's event data
store.
-
Click REPORTS from the Project
Home menu.
-
Click Create in the List Reports
page.
The Select Report Type page appears.
-
Select
Activity
Over Time from Activity
Reports.
-
Type a report title and description.
-
Select one or more projects from the PROJECT(S)
drop-down list.
-
Select the number of days from the LAST N DAYS drop-down
list.
-
The default Display Type is
EventsDual.
-
Select report visibility: Public or
Private.
-
Click Preview.
-
Click Create.
The report is created and the View Report page
appears.
Print or download
charts
You can print charts or download them as .PNG, .JPG, .SVG
or .PDF files using the print/download quick function icon.
-
Click Back to Reports List to go back to the Reports
dashboard.

