Average Age Report

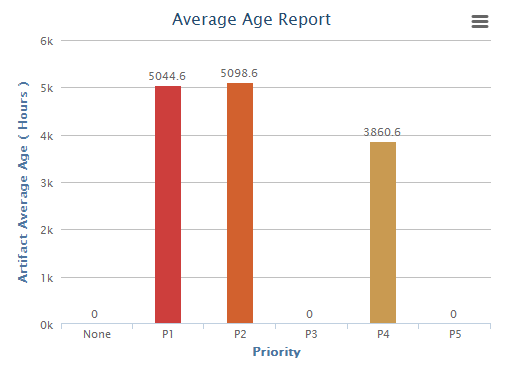
The average age chart lets you know the average age of artifacts in one or more trackers you select.

You can:
  • Generate this report to know the average age of artifacts in various units of time such as number of hours, days or weeks.
  • Group this report either by artifact priority such as P1, P2 and so on or by both artifact priority and category.
  • Generate this report for either open or closed artifacts.
  • Exclude weekends from being included in the average age calculation.
  1. Click REPORTS from the Project Home menu.
  2. Click Create in the List Reports page. The Select Report Type page appears.
  3. Select Average Age Report from Trend Reports.
  4. Type a report title and description.
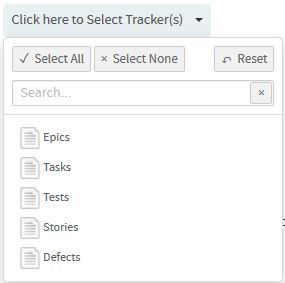
  5. Select one or more trackers from the SELECT TRACKER(S) drop-down list.
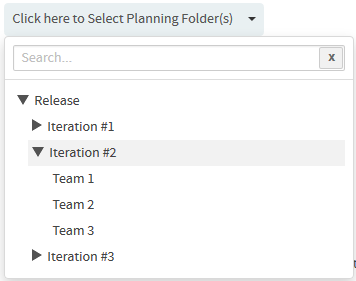
  6. Select a planning folder from the SELECT PLANNING FOLDER(S) drop-down list.
  7. Select one of the time units such as hours, days or weeks from the AVG. TIME IN drop-down list.
  8. Select either Priority or Priority & Category from the GROUP BY drop-down list.
  9. If required, select EXCLUDE Weekends check box to exclude weekends from being included in the average age calculation.
  10. Select either Open Only or Closed from the OPEN VS. CLOSE drop-down list.
  11. Leave the CHART DISPLAY TYPE as Stackedcolumns, which is the only available chart type for this report.
  12. Select report visibility: Public or Private.
  13. Click Preview.
  14. Click Create. The report is created and the View Report page appears.

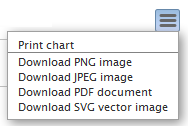
    Print or download charts

    You can print charts or download them as .PNG, .JPG, .SVG or .PDF files using the print/download quick function icon.

  15. Click Back to Reports List to go back to the Reports dashboard.