The cumulative flow chart shows the progress of backlog items by status for a sprint or a release.
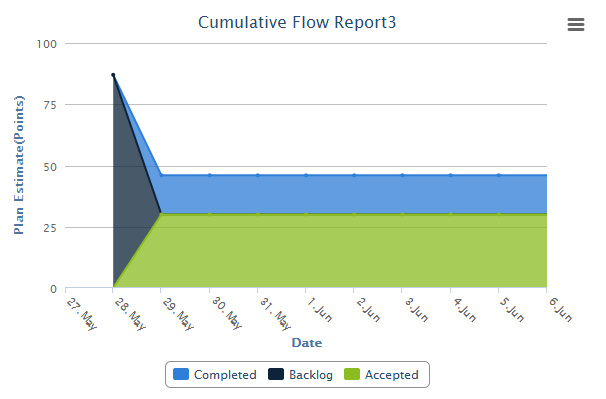
- Generate this report to see the rolled up status chart of scheduled work items in a release or a sprint.
- By viewing the rolled up status of backlog items by date, you can forecast whether you are on track or not, adjust the scope if required and identify bottlenecks in your release or sprint.
- You have 'Date' in the X axis and 'Plan Estimate' in terms of number of points in the Y axis.
-
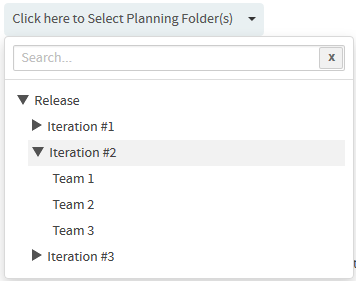
Select a planning folder from the SELECT PLANNING
FOLDER(S) drop-down list.
-
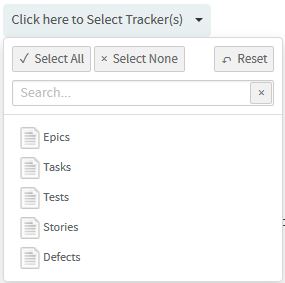
Select one or more trackers from the SELECT TRACKER(S)
drop-down list.
-
Click Create.
The report is created and the View Report page
appears.
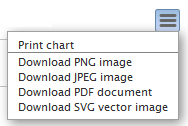
Print or download charts
You can print charts or download them as .PNG, .JPG, .SVG or .PDF files using the print/download quick function icon.