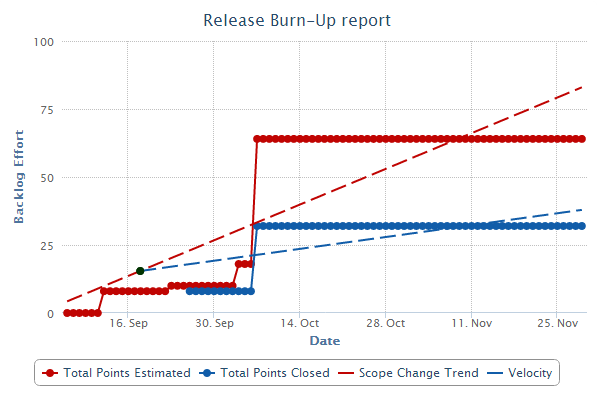
The Release Burn Up Chart shows the work progress to date against the total planned work. This chart shows the total planned work, total work completed to date and the rate of progress (velocity).

Important: You must have the planning folder's start and end dates
defined to generate this chart.
This chart includes a trend line to show the planned work scope change between a release's start and end dates (in other words, the start and end dates of the release's planning folder). Optionally, you can also include a trend line in the chart that forecasts when planned work might be completed depending on the average rate of progress (velocity).

