Artifact Distribution Chart (Multiple Trackers)

Using this chart, you can report the status of artifacts belonging to more than one tracker or planning folder. You can also create charts based on a combination of more than one tracker and planning folder.

  1. Click REPORTS from the Project Home menu.
  2. Click Create in the List Reports page. The Select Report Type page appears.
  3. Select Artifact Distribution Chart (Multiple Trackers) from Distribution Reports.
  4. Type a report title and description.
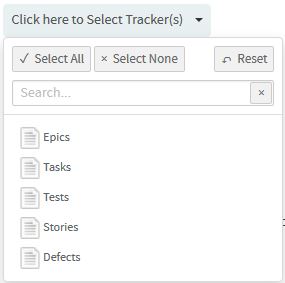
  5. Select one or more trackers from the SELECT TRACKER(S) drop-down list.
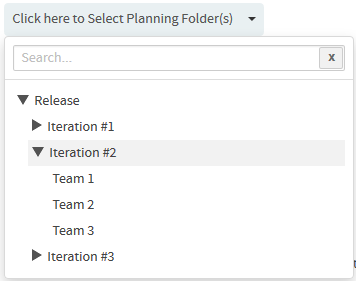
  6. Select a planning folder from the SELECT PLANNING FOLDER(S) drop-down list.
  7. Select one of the options from the DISTRIBUTE BY drop-down list.
  8. Select one of the options from the OPEN VS CLOSE drop-down list.
  9. Leave the CHART DISPLAY TYPE as Pie, which is the only available chart type for this report.
  10. Select report visibility: Public or Private.
  11. Click Preview.
  12. Click Create. The report is created and the View Report page appears.

    Print or download charts

    You can print charts or download them as .PNG, .JPG, .SVG or .PDF files using the print/download quick function icon.

  13. Click Back to Reports List to go back to the Reports dashboard.