Use this chart to know the number of opened and closed artifacts over a period of time across one or more trackers or planning folders. This chart also helps in knowing the number of associated commits in specific repositories over a period of time. You can also know the total number of open artifacts through this chart.
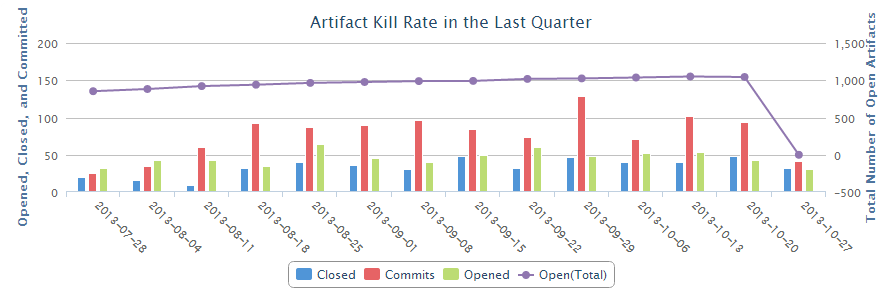
The number of opened and closed artifacts, and the number of associated commits are shown as color-coded bars (scale on left Y coordinate axis) and the total number of open artifacts is shown as a color-coded line (scale on right Y coordinate axis). The X coordinate axis shows the time scale of the chart.
At least one of the reporting parameters such as the Tracker ID, Planning Folder ID or the Repository ID is required to generate this chart. The following table lists the various reporting parameters for Artifact - Open/Close Chart (Multiple Trackers).
-
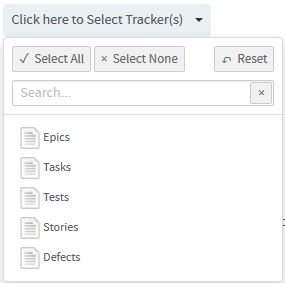
Select one or more trackers from the SELECT TRACKER(S)
drop-down list.
-
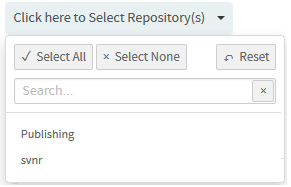
Select one or more repositories from the SELECT
REPOSITORY(S) drop-down list.
-
Click Create.
The report is created and the View Report page
appears.
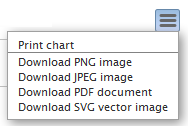
Print or download charts
You can print charts or download them as .PNG, .JPG, .SVG or .PDF files using the print/download quick function icon.