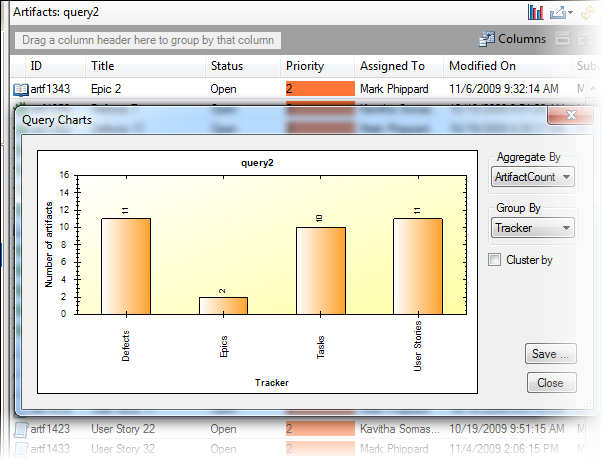
Query charts help you graphically visualize tracker query results on your Favorites pane.
Here's an example:


- You can group the artifacts in the query results in various ways, for example, by Priority, Submitted By, Assigned To or Date. Additional options are available depending on the query level - all queries, site-wide, project-wide or release-wide, or tracker-wide.
- You can aggregate the artifacts by artifact count, an effort field, or story points.
- You can cluster query results by artifact status - Open vs Closed.
- You can save the chart to an image file.